

There are some randomized steps to the processing so there are always going to be slight differences in the results. It is not a deterministic process.
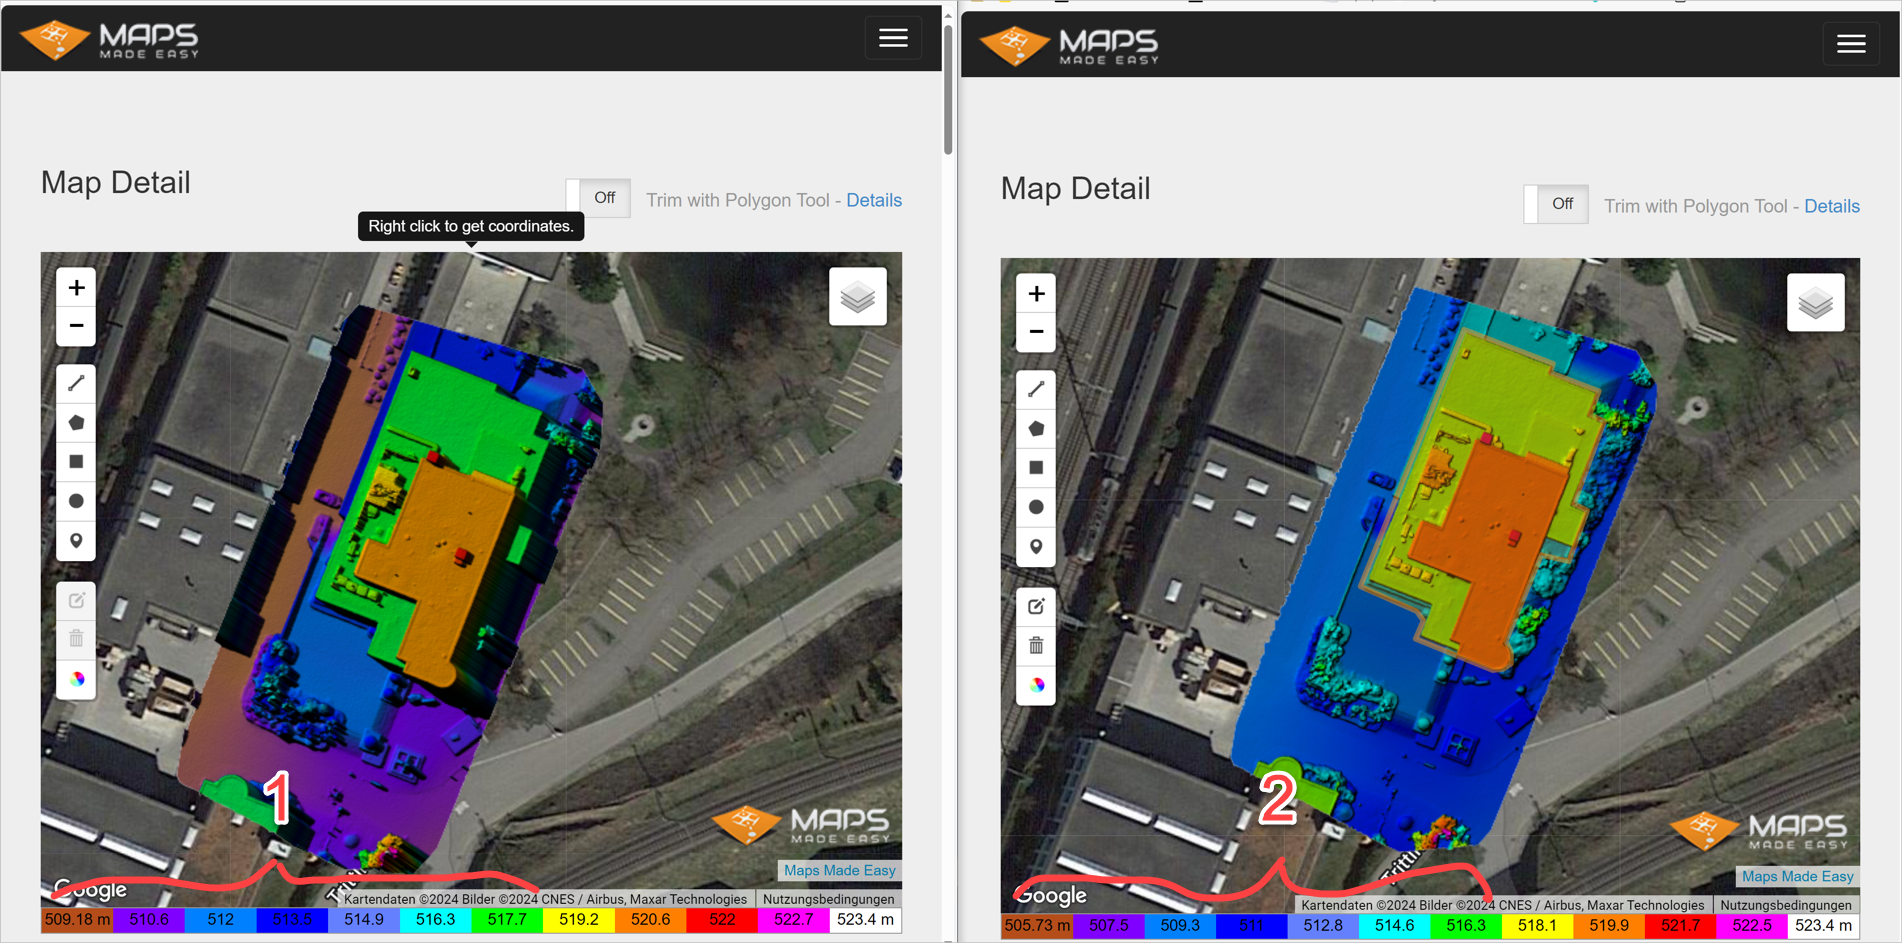
Map #1 looks like it was scaled down which will affect things too. The color bar at the bottom gives general ranges based on the minimum and maximum values in the DEM. If there is a little peak or low point it will change the ranges slightly. The real question is what is says when you have over areas on the map to see the actual calculated elevation it the top right corner.
The model for #1 looks to be slightly rotated which will also affect the numbers.
I see some other maps for this location and can see that they turned out very similarly to #2 so it is likely there are some differences in the settings for #1.
Volume measurements are not going to be great for measuring the volume of a building but the volume measurement process is a relative measurement. It is just looking at the height for each pixel and subtracting off a calculated bottom value and then multiplying by a known area to give the volume. This process is repeated for every pixel within the defined measurement polygon. So, if the model is different or the measurement polygon is different then the volume result will be different. The volume measurement stuff is designed to be used with stockpiles on flat-ish ground.